Monitoring and Logs
Stargate includes built-in monitoring and log collection services that run alongside the application containers.
Components
| Service | Port | Purpose |
|---|---|---|
| node-exporter | 9100 | Host-level metrics (CPU, memory, disk, network) for Prometheus |
| version-collector | - | Collects app versions from /liveness endpoints |
| Alloy | 12345 | Docker log collector - ships container logs to Loki |
| Loki | 3100 (internal) | Local log aggregation backend |
| Dozzle | 8190 | Web-based container log viewer (HTTPS, Keycloak SSO; optional) |
| oauth2-proxy | 8190 | OIDC relying party that authenticates Dozzle access (with Dozzle) |
Dozzle - Local Log Viewer
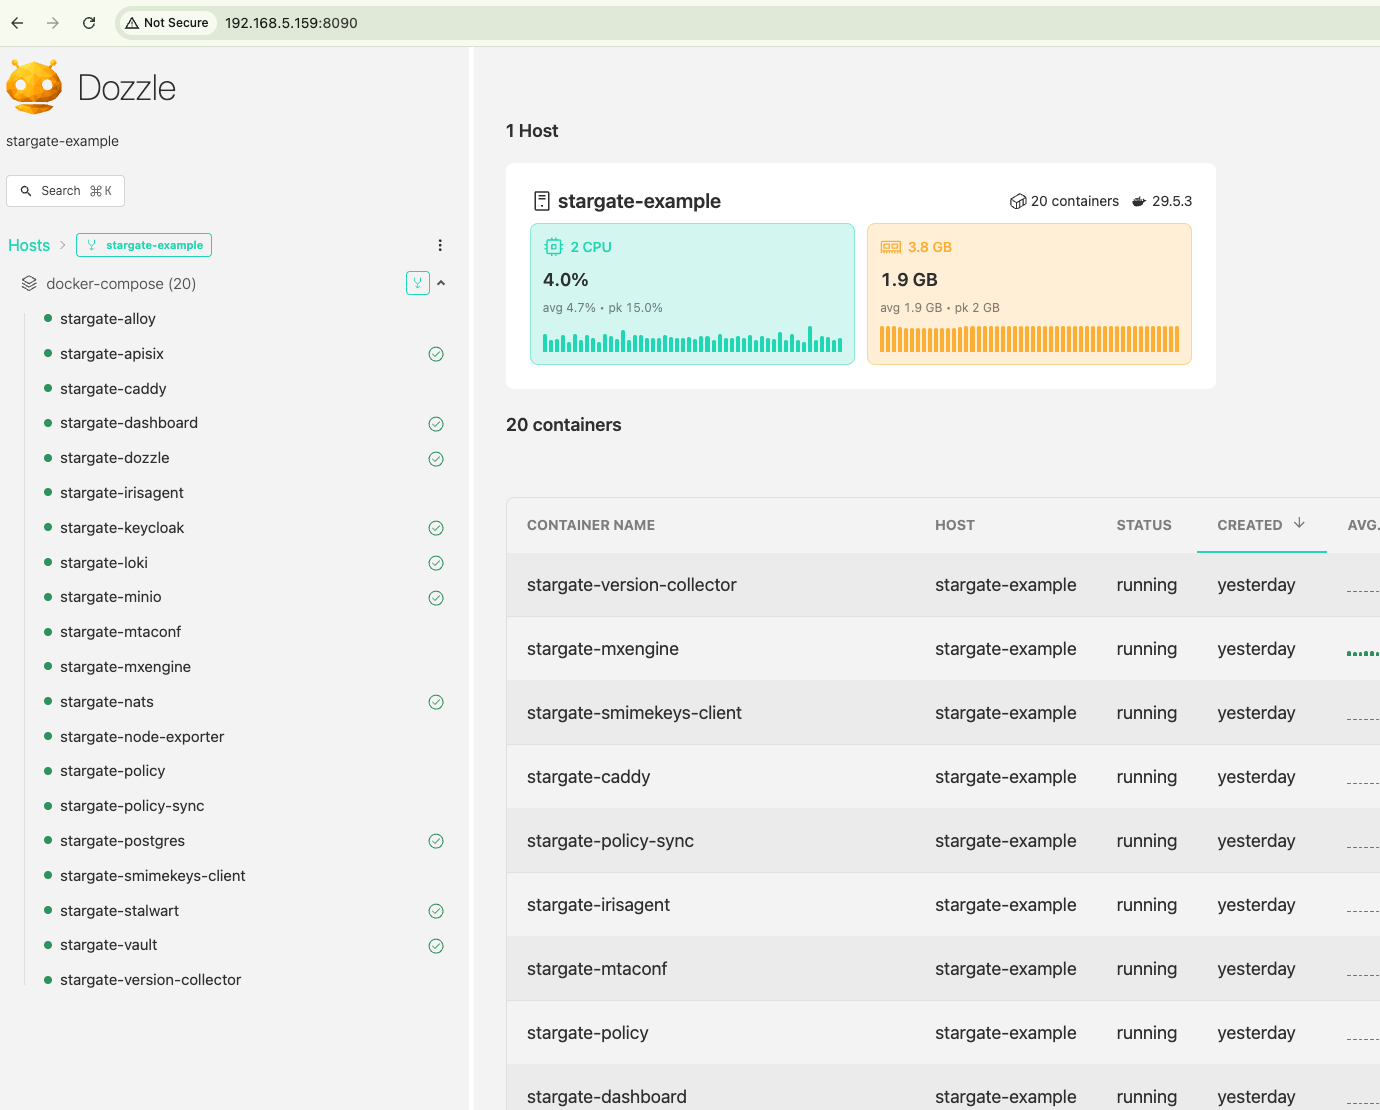
Dozzle provides a web-based UI to view real-time logs from all Stargate containers. It is optional and enabled by setting DOZZLE_ENABLED="true" in customer-config.sh.
Access is protected by Keycloak: an oauth2-proxy sits in front of Dozzle and requires the same login as the dashboard (the stargate realm). Dozzle itself is not exposed directly.
Access: open https://<SERVER_IP>:8190 in a browser and sign in with your HIN Gateway (Keycloak) credentials.
Note
Port 8190 (HTTPS) must be reachable from your network. If you restrict access by IP or firewall, allow 8190/tcp as you do for the dashboard and Keycloak.
Logs are organized by service. By selecting a specific service, you can view its corresponding log entries and details.
Grafana Alloy - Log Forwarding
Grafana Alloy collects logs from all Stargate application containers and writes them to the local Loki instance. Optionally, logs can also be forwarded to a remote Loki-compatible endpoint for centralized monitoring.
How it works
- Alloy discovers Stargate containers via the Docker socket
- Logs are always written to the local Loki instance (used by the dashboard for log export)
- If a remote Loki URL is configured, logs are additionally forwarded to that endpoint
Configuring remote log forwarding
From the HIN Gateway dashboard, navigate to the Settings page. Under the Grafana Alloy section, enter the Loki push URL of your remote log collection server:
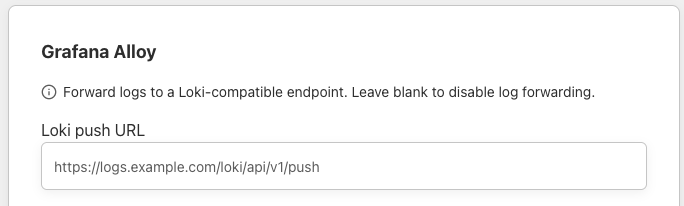
The URL should follow the standard Loki push API format:
Leave the field blank to disable remote log forwarding.
Note
Changes take effect within 1 minute (Alloy polls the dashboard configuration on that interval). No container restart is required.
Requirements on the remote side
Your remote Loki endpoint must be reachable from the Stargate server over HTTPS (port 443). If you use IP-based allowlisting on your ingress, add the Stargate server's public IP.
Prometheus Metrics
Stargate exposes Prometheus-compatible metrics endpoints from its application containers. These can be scraped by any Prometheus-compatible server for centralized metrics collection.
Available endpoints
| Service | Port | Path |
|---|---|---|
| smimekeys-client | 2113 | /metrics |
| irisagent | 2114 | /metrics |
| policy | 2115 | /metrics |
| mxengine | 2116 | /metrics |
| node-exporter | 9100 | /metrics |
| APISIX | 9091 | /apisix/prometheus/metrics |
Scrape configuration
Add the Stargate server as a target in your Prometheus configuration. Example for a single instance:
scrape_configs:
  - job_name: 'stargate-<name>-smimekeys'
    static_configs:
      - targets: ['<STARGATE_IP>:2113']
        labels:
          environment: 'stargate-<name>'
          service: 'smimekeys-client'
    metrics_path: /metrics

  - job_name: 'stargate-<name>-irisagent'
    static_configs:
      - targets: ['<STARGATE_IP>:2114']
        labels:
          environment: 'stargate-<name>'
          service: 'irisagent'
    metrics_path: /metrics

  - job_name: 'stargate-<name>-policy'
    static_configs:
      - targets: ['<STARGATE_IP>:2115']
        labels:
          environment: 'stargate-<name>'
          service: 'policy'
    metrics_path: /metrics

  - job_name: 'stargate-<name>-mxengine'
    static_configs:
      - targets: ['<STARGATE_IP>:2116']
        labels:
          environment: 'stargate-<name>'
          service: 'mxengine'
    metrics_path: /metrics

  - job_name: 'stargate-<name>-node'
    static_configs:
      - targets: ['<STARGATE_IP>:9100']
        labels:
          environment: 'stargate-<name>'
          service: 'node-exporter'
    metrics_path: /metrics
Replace <STARGATE_IP> with the server's public or private IP and <name> with a deployment identifier (e.g., prod, customer-name).
Tip
The environment and service labels enable filtering in Grafana dashboards across multiple Stargate instances.
Firewall requirements
The metrics ports (2113-2116, 9100) must be reachable from your Prometheus server. If you restrict access by IP, add your monitoring server's IP to the firewall rules.
Node Exporter
The node-exporter service exposes standard host-level metrics (CPU, memory, disk I/O, network) on port 9100. It also includes a textfile collector that exposes custom metrics from the version-collector sidecar (application version information).
Summary of exposed ports
| Port | Service | Protocol | Purpose |
|---|---|---|---|
8190 | Dozzle (via oauth2-proxy) | HTTPS | Authenticated log viewer UI (Keycloak SSO) |
9100 | node-exporter | HTTP | Host metrics (Prometheus) |
2113 | smimekeys-client | HTTP | App metrics (Prometheus) |
2114 | irisagent | HTTP | App metrics (Prometheus) |
2115 | policy | HTTP | App metrics (Prometheus) |
2116 | mxengine | HTTP | App metrics (Prometheus) |
9091 | APISIX | HTTP | Gateway metrics (Prometheus) |